Tracking my life in 30 minute blocks
Starting in 2023, I have tracked every half hour block in my life. Everything I do is categorized into one of currently 61 categories of activities, ranging from “Sleep” and “Work” to “University Teamwork” and “Political Activism”. Since I am now in the third year of time tracking, the categories have shifted somewhat (for example last year I thankfully did not need the category “Moving appartments”), with the specificity somewhat increasing over time.
I like knowing what I have done on a particular day, and I also like being able to look back months later and use the tracked activities to figure out what I was doing. It also helps me in disciplining myself, trying to avoid “red days”, spend mostly on passive time (e.g. YouTube, Reddit). And in the past I have also used for tracking working hours for accounting purposes.
Right now I am using a Google Sheets table. This is nice because it is available everywhere. However, putting in entries on mobile is a pain, as I am using keys composed of numbers and letters (so 6 is gaming and 6b is multiplayer gaming), which are cumbersome to enter on a keyboard. So I am thinking of perhaps developing a custom tool for that purpose (maybe a Pebble application to input the last activity for my Smartwatch?).
With all this data, of course I can now make some observations. I downloaded the data for 2024 from the Google Sheet and have created some heatmap that show when I do a particular activity. For these heatmaps, 52 would be the highest possible value, meaning I did that activity in that 30 minute slot on that day of the week every week.

Work is not that surprising, since in 2024 I worked full time for 6 months. During workdays you can clearly see the nice long French lunch break.
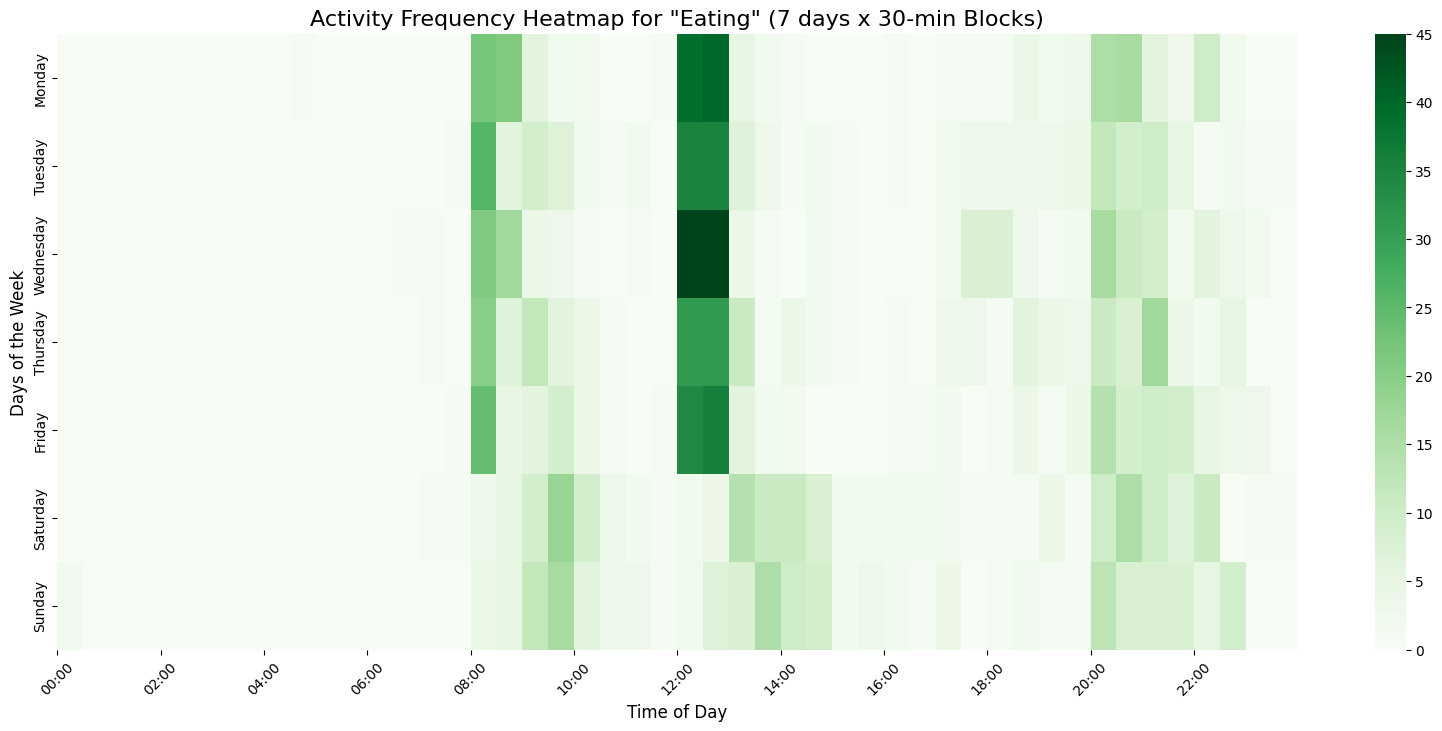
Lunch breaks are often filled with eating, so in this heatmap, lunch breaks are also visible. By the way, for tracking purposes I separate between “Eating Alone” and “Eating Together”, but these are aggregated here. You can also make out three distinct meals per day, no surprise there, and more interestingly that breakfast and lunch are shifted back on weekends.

Sleep shows a similar pattern, with it being shifted forward on weekends. Having more sleep is always a noble goal, so what is keeping it from being achieved?
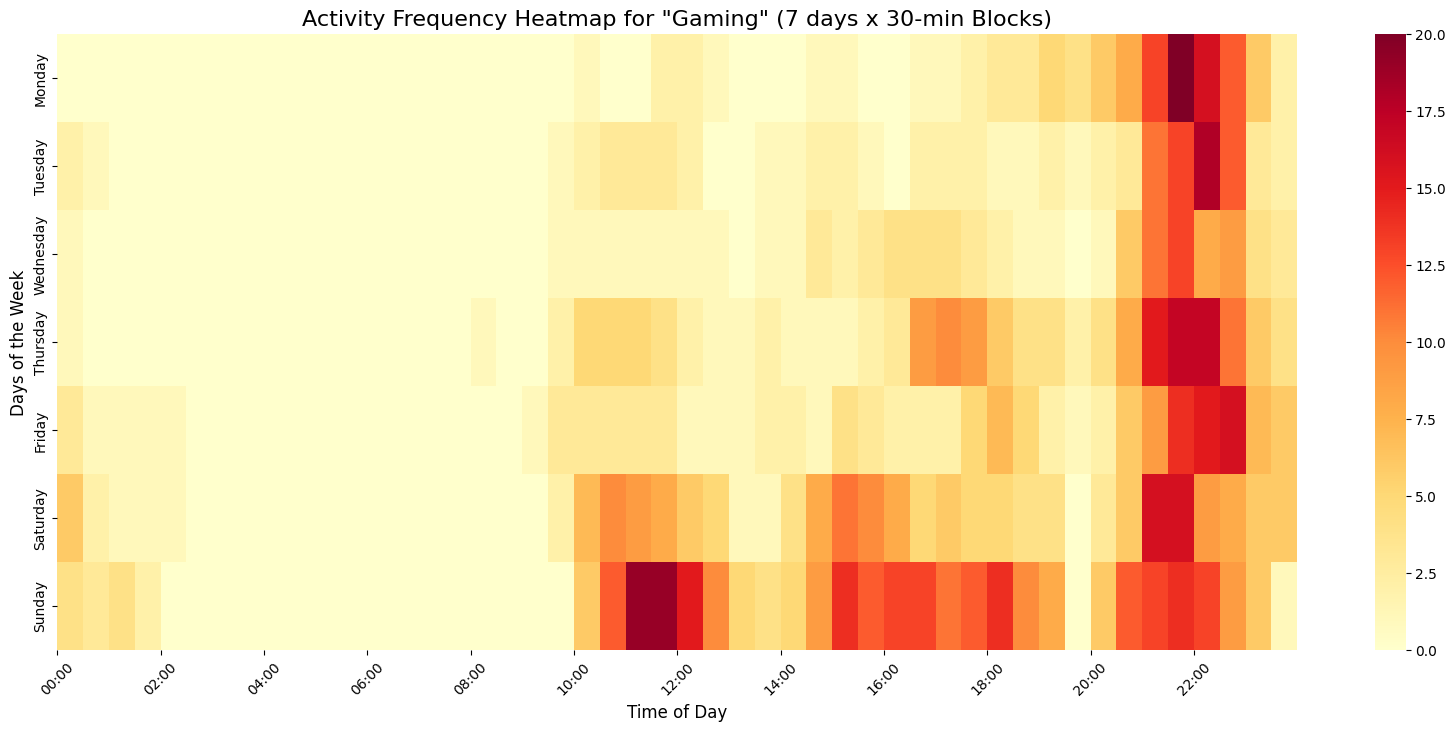
Well, playing games is at least part of the reason, as you can see that it fills many evenings. One thing I only noticed with these graphs is that Sunday seems to have been my gaming day.

The final heatmap shows part of the reason why I wasn’t playing so many games on Saturdays, as I did more exercise on that day. Also, a strong pattern can be observed of exercise at 18:30. This was during my stay in France when I went swimming every day at that time.
To further explore what this “exercise” actually was, I created these graphs. Here you can see the number of time slots per month filled with a specific kind of exercise.
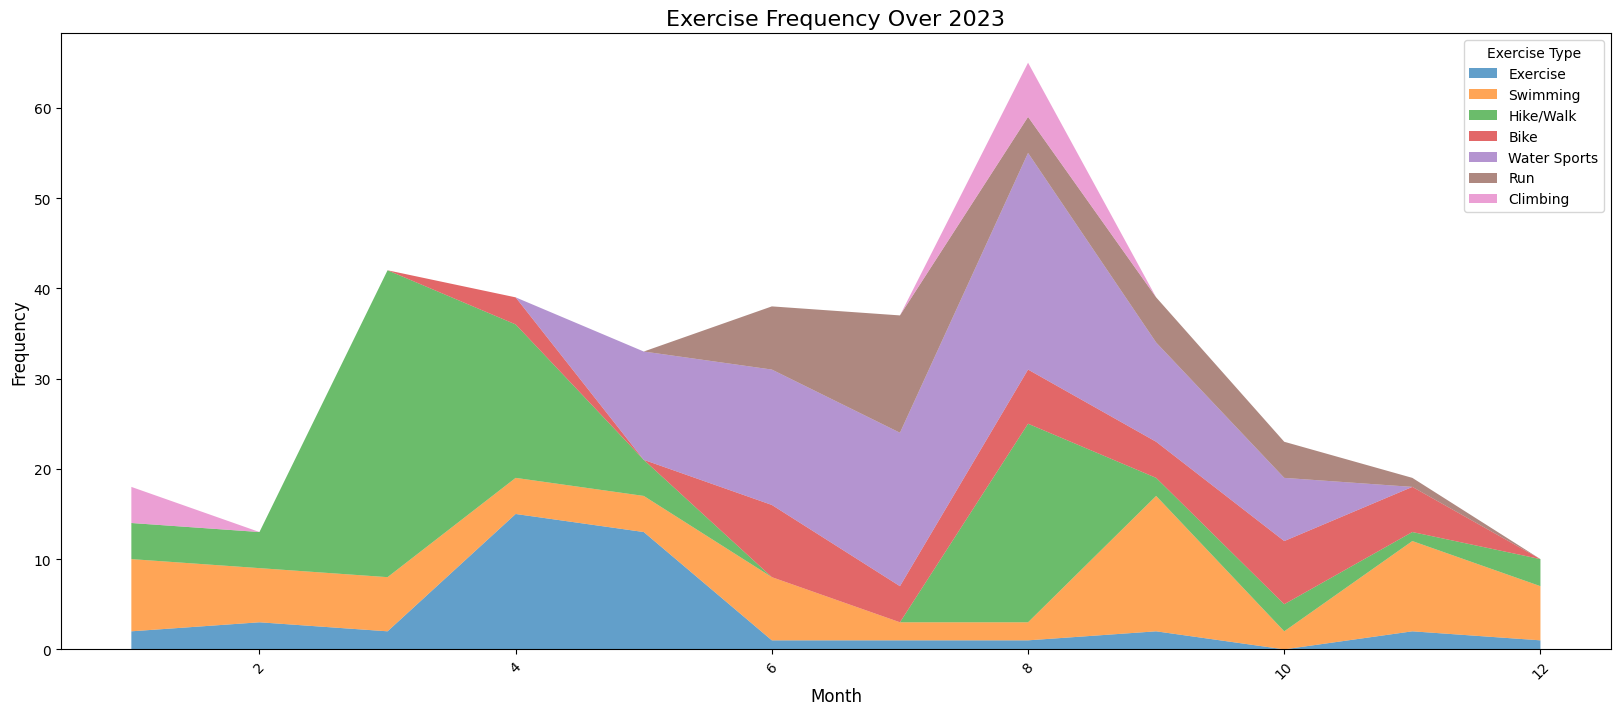

As you can see, the graphs show quite different results for 2023 and 2024. In 2023, I had a much more diverse selection of exercise, while in Potsdam I did windsurf (purple area), which is grouped under “Water Sports” here, and during the summer I also did some running. In 2024, I mostly just went hiking on the French Riviera and regularly went swimming, I stopped running and did not do windsurfing (which was a shame).

The total slots of exercise per month can be seen here. It is clear to see that summer is the most active period and that 2024 was moderately more active than 2023.
For the final plots, I calculated a “productivity score” per day. Different activities increase the productivity score in different ways, e.g. Work increases it by 1 as the baseline, while chores only increase it by 0.5, since they can be used pretty well for procrastinating (speaking from experience).

For 2023, you can see the semester breaks, where productivity drops, ca. between 50 and 100 days and between 220 and 300 days.

For 2024, productivity is pretty similar over the 6 months I worked at SAP, since I had fixed working hours. Afterward, productivity fell dramatically and slowly recovered. For christmas, productivity is low as expected (and desired!).
If I get more ideas for graphs, I may add more, otherwise this is it for this post. Of course, I have not stopped time tracking and continue to produce new data!